Streamflow Conditions for Fly Fishing
Through interactive maps and graphs, Whacking Fatties provides numerous ways to investigate streamflow data for your favorite fly fishing streams.
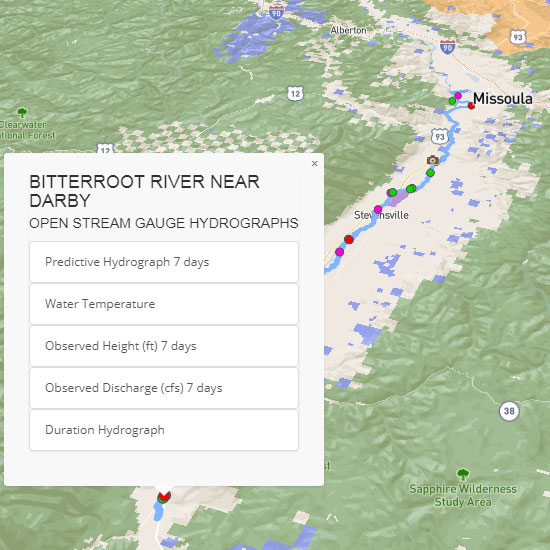
Red dots represent stream gauges.
Click the gauge closest to where you plan to fish.
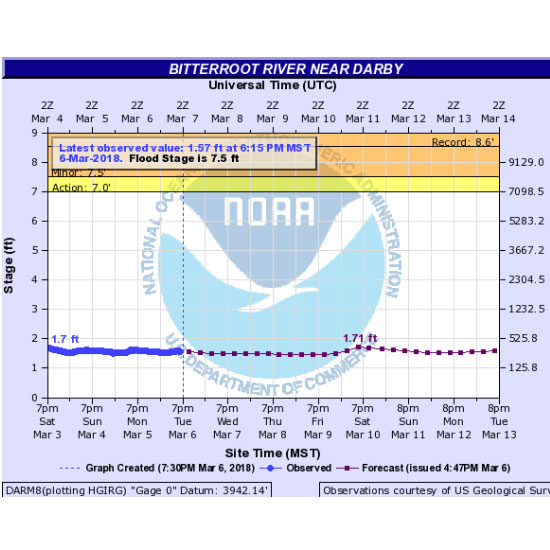
Predicative Hydrographs
Hydrologic forecasts for almost 4,000 locations across the United States are provided by the National Weather Service (NWS) Advanced Hydrologic Prediction Service (AHPS).
When available, hydrographs are provided to help determine fishing conditions based on future streamflow trends.
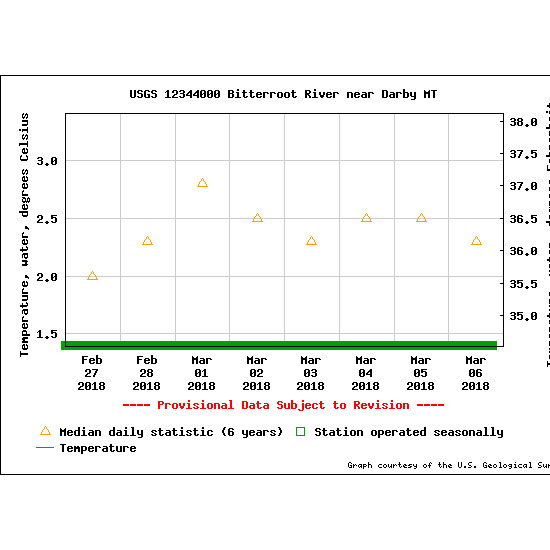
Water Temperature
When available from the USGS, water temperature information is provided.
Anglers should take into consideration stream temperatures. When temperatures in moving water are exceedingly high, it's best not to stress fish and return another day. Pay attention to stream closures during these times.
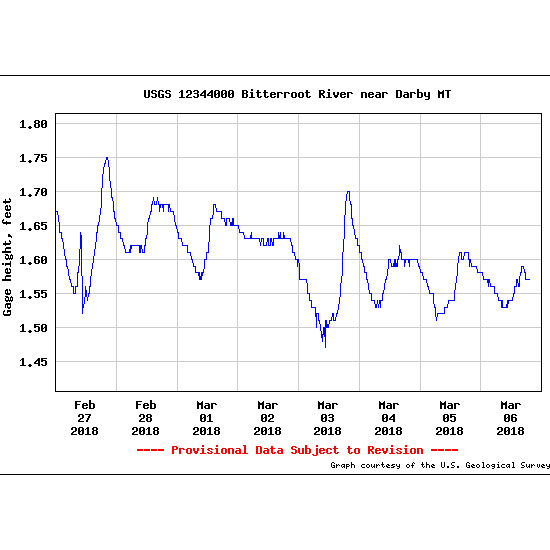
Observed Height Graphs
Use gage height combined with local knowledge to help predict favorable conditions for fly fishing. The river may be high, but quite fishable if it has been dropping and has had time to clear. Likewise, the height and flow may appear impeccable, but if the stream actually gained a foot recently, there may be debris and lots of silt. Therefore, it is important to take into consideration the overall trend. Exact readings may help determine specific conditions of known areas with debris.
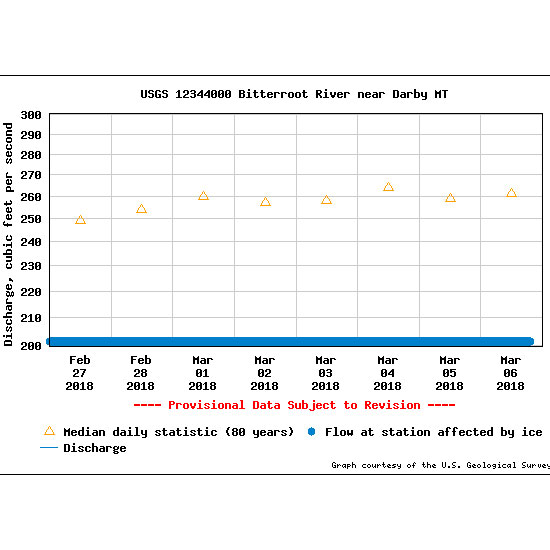
Observed Discharge
Most stream gauge stations show days of current conditions discharge (streamflow) data and historical data (median daily streamflows).
All measurements are in cubic feet per second and the triangles on the graph denote the average flow measured on that day of the year.
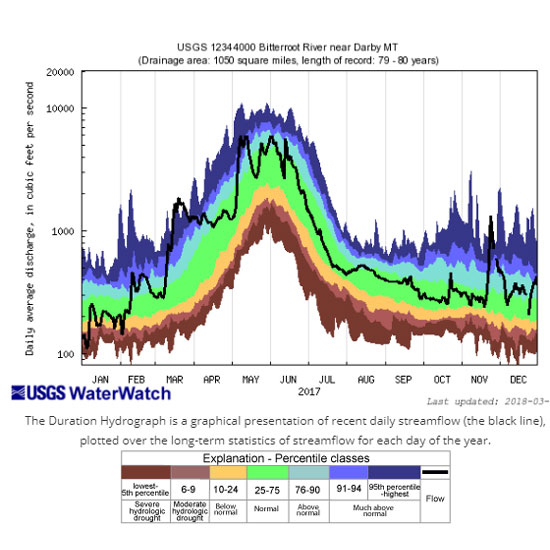
Duration Hydrograph
The colorful Duration Hydrograph is a graphical presentation of recent daily streamflow (the black line), plotted over the long-term statistics of streamflow for each day of the year.
This graph may help to predict spring blowouts or low water periods relative to historic data.
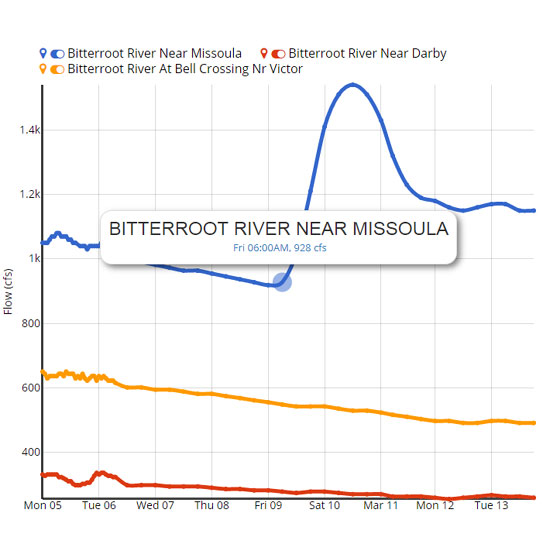
Flow Readings Along Stream
Visualize all gauges along a river in one graph.
We plot all available streamflow information in one graph for each stream.
Click on a to zoom to the gauge in the map.
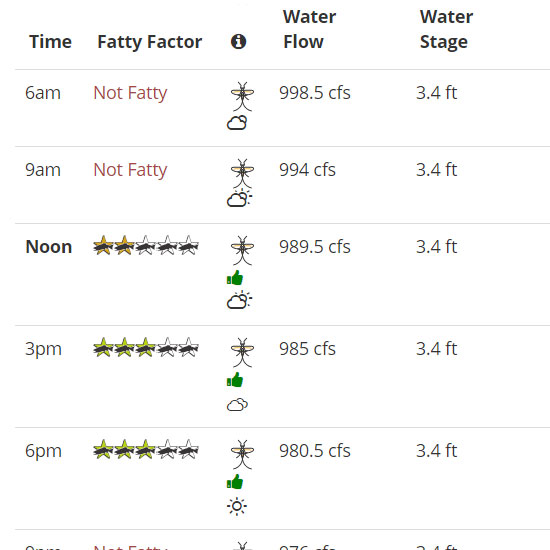
Hourly Streamflow Forecast
Along with the Fatty Factor, we provide hourly streamflow information.
indicates the fishing is getting better.
means conditions are trending down.
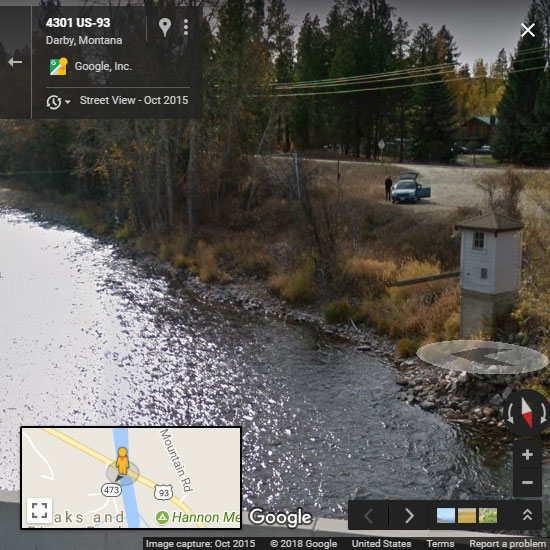
Gage Station Photographs
Where available, stream gauge stations can be seen in photographs provided by Google Street View.
Visualizing the cross section of river where stream gauge readings are observed can help better understand and interpret conditions and predictability of fly fishing conditions.